Global Markets 2014 and Perspectives for 2015
Summary
We are positive for the future of equity markets as central banks will likely stay easy and governments will do everything to keep the economy afloat. Global developments should profit equity markets as money is cheap and bond prices, especially government bonds of developed countries, are high. A rebalance from bonds to stocks, called the great rotation, is likely to happen over the next couple of years.
In case money from bond markets flows into equity markets, we could see much higher equity prices than today. Black swan events (events with low occurrence probability) can change the whole investment environment and have adverse effects on global equity markets. However, to build wealth, investing in equities is one of the best ways as historic equity returns show an outperformance over most other asset classes.
Shoreline 2014 – Market Overview
A brief look back shows that last year the best-performing major market was Shanghai A-Shares, rising nearly 50%, most of which came in the last three months of the year in response to a weakening economy and central bank policy toward supporting financial assets. This made the point again that financial markets are largely about policy and that in many cases, bad economics can equal good returns. Government bonds, especially in developed markets, showed very good results. Italian bonds lead to a return of over 24% in 2014. German bunds did well too. They returned around 15%. Driven by ECB statements and the announcement of ECB head Mario Draghi to start a European quantitative easing program. The best performing developed equity market was the S&P 500 in the United States, which rose almost 15% over the year. The best performing currency was the US dollar, rising against all major currencies. The worst performing asset class was commodities, namely iron ore and oil. Brent Crude dropping in price in 2014 by around 50%.
For stock markets, the worst performer was the Russian equity market, losing almost 50% in 2014. The fall in the oil price had an impact on the Russian stock market and the Russian economy, however a number of other markets with a heavy weighting to energy were negatively affected as well. For example, the FTSE 100 index was flat on the year. But had oil stocks been excluded, the rise would have been closer to 6% or 7%. The American high-yield market underperformed the stock market because of its weighting to energy as well. So you could say the three biggest events of 2014 were the runaway market regarding Chinese equities; the strong dollar, the declining US trade balance, and on the other side, the action of central banks, such as the European Central Bank (ECB), to loosen policy; and the sell-off in oil. Further market data can be found in Appendix 1.
United States of America
The United States stock market index, represented by the S&P 500, was the best performing developed markets index in 2014. In addition, US treasury bonds did very well. Taking the appreciation of the US Dollar and the return on bond investments into account, investments in US bonds were very profitable for foreign investors. For US citizens this might look different, especially at the moment, where bond yields are at ultra low levels (around 2% on 10-year notes). With an inflation rate of around 1.3% the real return is only 0.7%. Expectations we had last year, that bonds would perform badly compared to equities, were not fulfilled. The timing might have been off, but we still hold the position that it is not recommended to invest in US treasuries. The two figures below show the development of treasury yields. Rates are at historic lows, although the US government is holding more debt than ever before. 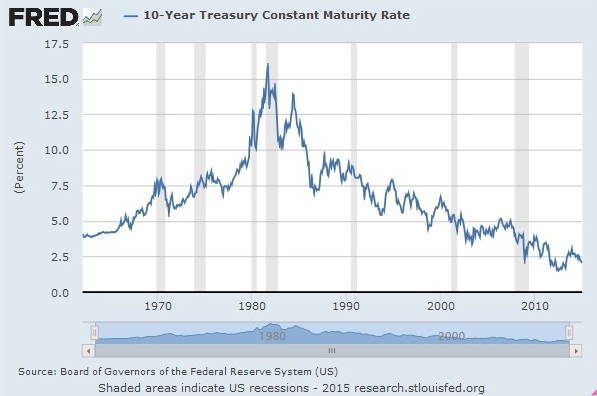
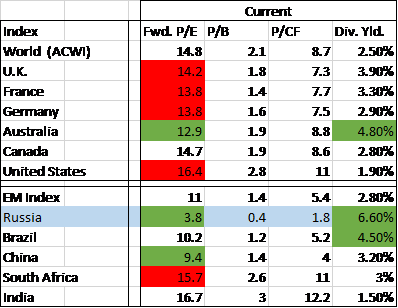
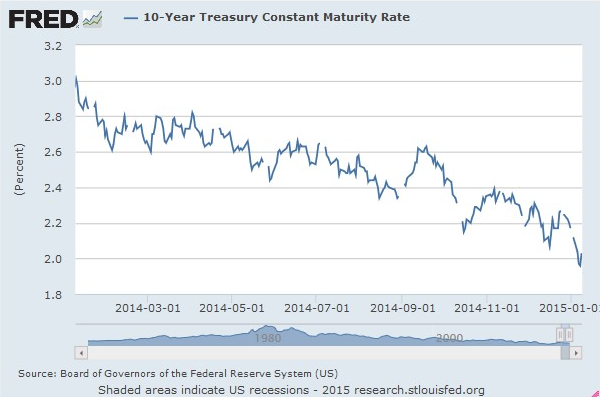 Low rates also indicate that prices for 10-year bonds are very high. A real return of 0.7% doesn’t appear particularly attractive to take the risk for lending to the US government For US investors the wiser investment decision for 2014 was to put money in the equity market. Dividends and capital gains clearly outpaced returns that were achievable in the US treasury market. The downside of equity investments is the higher risk. As one can see in the chart below, the S&P 500 made a +204% gain from its low in 2009 until the end of 2014. The forward Price-to-Earnings (P/E) ratio stands at 16.2 (Compared to an 10-year average P/E of 14), means the S&P 500 could be considered quite expensive.
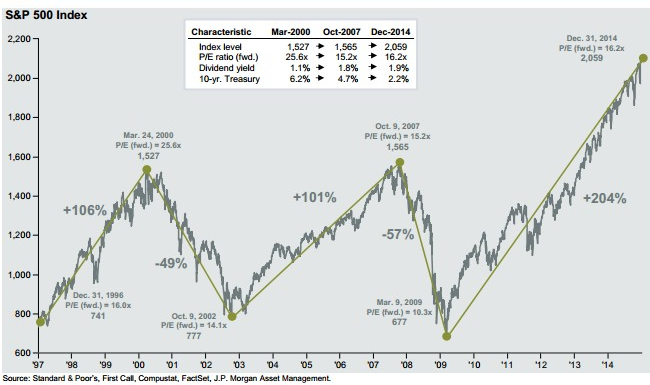
Valuation Comparison
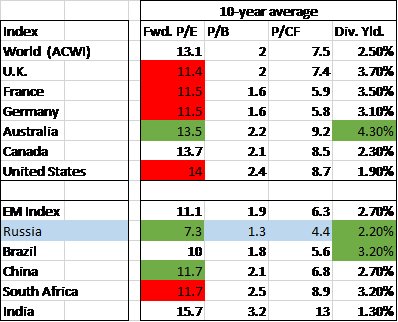
Compared to the S&P 500, other markets had a bad year in 2014, which is also reflected in valuations. The Russian market lost almost 50% of its value from its peak in 2014. Pure valuation figures show that in the current state, the Russian market is heavily undervalued. Current P/E stands at around 3.8, compared to a 10-year average of 7.3, which shows the discount for political risk. Dividend yields are also very attractive. The most attractive equity market in developed countries judged solely on valuations is Australia. Current P/E stands at 12.9, compared to 13.5 on average, with an average dividend yield of 4.8% appears. This appears attractive until we see the heavy bias of commodity-exposed equities.
 Valuation figures above show clearly that developed market equities appear to be expensive.
The great rotation
The following graphic shows fund flows into bonds and stocks. A notable movement took place after the financial crisis of 2008 where flows into bonds picked up remarkably. In figures, from 2007 until November 2014 US$1.406 trillion found its way into the global bond markets, compared to only US$707 billion in stock markets over the same period. Compared to last year, funds that went into bond markets had almost no change. However, funds flowing into equity markets almost doubled. In November 2014, the figure stood at US$707 billion compared US$378 billion in August 2013. The money flow shows that bonds are less attractive than equities at current valuations. 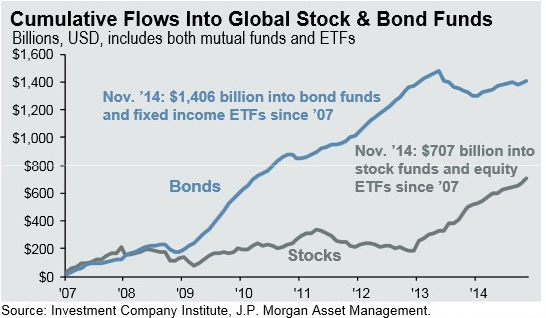 We expect these figures to narrow. The financial press also calls this process the ‘Great Rotation’ out of bonds into stocks.
The next figure shows that most of the money invested in equity funds comes from institutional investors. Retail investors lag behind, sitting on the sideline. Unless investor sentiment changes, it could lead to a rapid redeployment of money by retail investors, driving up equity markets. 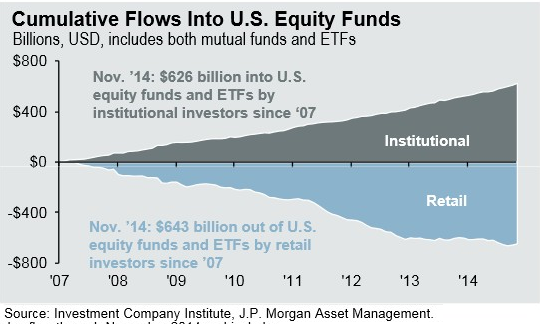 Regarding the last figure we are quite optimistic for equities in the year 2015. Many institutional investors have more resources for research and development. These investor often “make” trends and retail investors try to jump on board later, often too late.
Oil Prices
Oil was one of the main topics in 2014, and will probably be an even bigger topic in 2015. In the chart below one can see that West Texas Intermediate (WTI, the black line in the chart below) and Brent oil (blue line) dropped by more than 50%. The price decline only started during the second half of 2014. Currently the price for oil is at around US$45 per barrel. 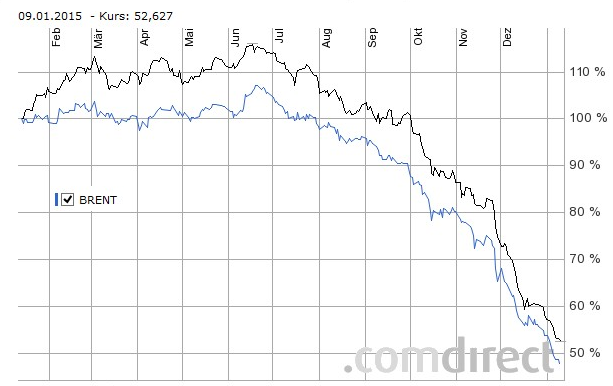 Analysts and financial journalists have speculated about why and how the oil price has fallen so rapidly. We think that a long period of high oil prices pushed new technology and increased exploration, along with less oil use in a slowing global economy has caused a huge oversupply. Without enough demand, This is what happens now. Although we think that the price decline is too fast and is already driven by speculation. Eventually we should see higher quotations again, but this could be years away.
The main reason for the increase in supply is the booming fracking industry in the United States. The figure above right shows that since the financial crisis in 2008/2009 rig count in the oil fracking industry sky-rocketed. 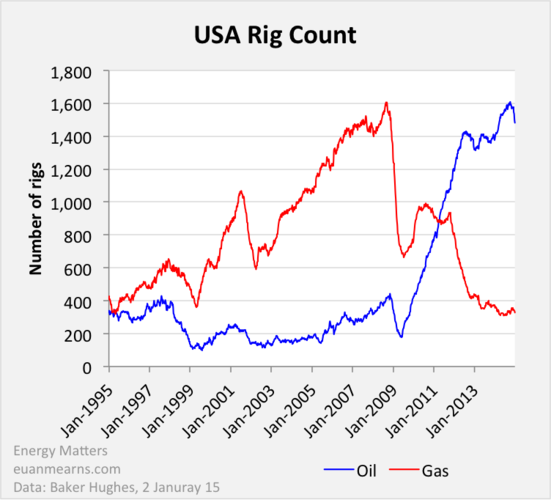 This oil production is turning the US from a net importer of oil to a possible oil export country.
Gold
2014 was a non event year for gold in US Dollar terms. US$1,200 was established as a support level and a significant drop below this area would lead to further selling pressure. A fact that gives us a more bullish view on gold is that the US Dollar strengthened significantly without putting much pressure on the gold price in 2014. Usually the gold price falls when the US Dollar strengthens. Simply because gold is seen as a safe haven, especially in the currency markets. In 2014 gold lost 1.53% in US Dollar terms, but gained in other major currencies. In Euro prices, gold increased 13.51%, and in British Pounds gold increased by 7.42%. Other currencies are shown in the chart below. Gold should be part of every diversified portfolio as it has good characteristics as a store of value. 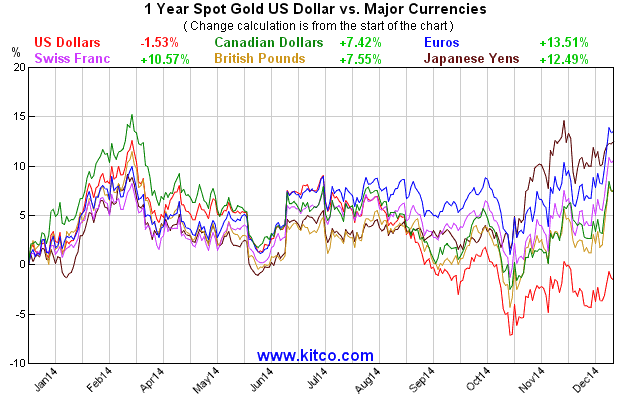
Looking ahead, where to invest in 2015?
Middle and Long Term Views
Key-Points:
- Global Divergence
- U.S. Dollar Strength
- Oil Price
- Rising Volatility
- Russia
- Conclusion and Solutions
Global Divergence
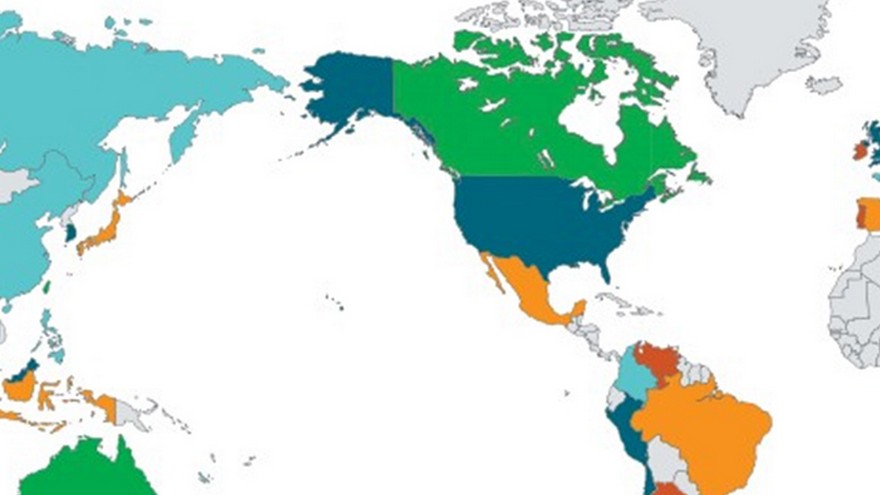
We expect 2015 to be a year of global divergence in economic growth and central bank policies. Our expectations are grounded on GDP growth forecasts for major economies and expectations that some some central banks will tighten fiscal policies, whereas others will loosen their policies. The graphic below shows the possible directions of selected countries and the Euro zone. Most likely the US and UK will be tightening their financial policies and starting to raise central bank rates. Other countries like China and India, but also the Euro zone, are expect to loosen fiscal policies. Global economic growth should further be determined by emerging market growth. However, economic growth in developed markets should pick up, contributing to a bigger share of global economic growth in 2015. For more on the compostion of global growth, please refer back to our October 2014 article. 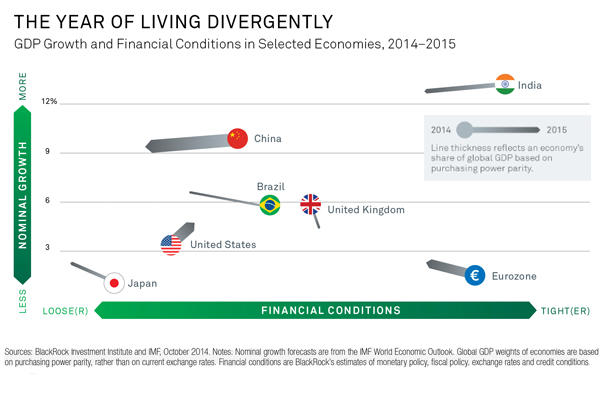 United States This divergence should support a further strengthening of the US Dollar. Nevertheless, we think that it is not in the interest of the US government and the Federal Reserve to let the US Dollar strengthen too much. A slow increase of interest rates, starting in the middle of 2015 is the likely outcome. A low expected inflation rate in the US is backing our view on a rather slow increase of interest rates in the US. UK The UK appears to be the least preferred market of the developed countries, as growth expectations slow and the Bank of England is set to tighten its policies. Europe The European Central Bank on the other hand, should loosen its monetary and fiscal policies over the course of 2015. One reason is the inflation rate that is close to zero, or even in deflationary territory. Another reason is the sluggish economic growth in the Euro area. Investments in the Euro area should preferably be made with Euro hedged investment vehicles, like ETFs, as we expect the Euro to depreciate against the US Dollar. Looser fiscal and monetary policies should boost European, equity markets. As a single market, we prefer the French equity market over other European markets as sentiment on France is already bearish, leaving space for surprise. Japan We think Japan will be the worst performer of developed market economies in 2015. However, the stock market might do well, due to central bank policies. As we stated before, a weak economy does not necessarily mean bad stock market performance. An investment in the Japanese stock market should be made with a currency hedge for security against a falling Japanese Yen. Emerging Markets The drop in oil price and other commodities makes investments in EMEA (Emerging Europe, Middle East and Africa) least preferable. We would select a few investments in Latin America, e.g. Brazil, for diversification and for high dividends. Elections in Brazil and other countries show a more socialist political trend. It does not seem to be the best climate for investors to make money.
We would suggest increasing exposure to Asia and especially India. India looks like the most attractive emerging market to invest over the next year. The major reason is the change in policies introduced by India’s new president Narendra Modi. The Modi government is moving to liberalize the Indian financial market to make it easier for foreign investors to enter the Indian market. Additionally, the Modi government wants to harmonize tax regimes between different Indian regions, which should make it easier to do business across India. A final factor is the lower oil price which will benefit India by reducing the trade deficit and boosting the economy. Many other Asian economies are also net importer of oil so a low oil price should help the entire region.
US Dollar strength is becoming a problem
“Our money your problem” – Currently many emerging markets realize the essence of this phrase. Argentina, Brazil, Russia and many other emerging markets face the same problem, their local currency devalues but companies and governments issued debt in US Dollars. As the local currency devalues, it makes repayments of US Dollar denominated debt more expensive. The graph below shows the strength of the US Dollar in comparison to a basket of other major currencies. Over the course of the last 6 month the US Dollar has appreciated by 15%, which means US denominated debt is 15% more expensive to service. 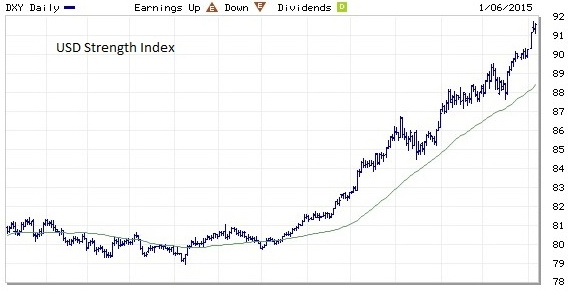 The US Dollar appreciation is a major threat for countries that borrowed in US Dollars. Economist call this circumstance “original sin” and a US$10 trillion debt bomb. Analysts at Morgan Stanley calculated that 63% of foreign currency debt is denominated in US Dollars, 19% in Euros and the rest in British Pounds, Swiss Francs and Japanese Yen.
This situation is serious and if the US Dollar strengthens further, it will become worse. The graphic below shows the BlackRock Sovereign Risk Index. The highest repayment probability is given to countries colored in green, going down to orange with lowest probability in red (please note this information is from July 2014). It is very interesting to see that countries which are most able to repay their foreign currency debt. Here Russia ranks in front of Belgium and France. Other countries, like Brazil, Japan, India and Italy follow in lower categories. BlackRock gives these countries a higher default probability than Russia. Which seems justified, as Russia has the sixth highest foreign currency reserves in the world. Although the Russian government intervened heavily in the FX market to support the Ruble, reserves still stand at US$388.5Billion (as of 26th of December).
Oil Price
Five determinants of oil price development:
– Global Economy
– U.S. Shale Oil and Gas
– Elasticity of demand
– OPEC
– Geo-political crises
Global Economy
Economic development is the major driver for the oil price. We expect the global economy to grow between 3-4% in 2015, mainly driven by continuing US growth and emerging markets, especially China and India. This provide a stable demand basis for oil. On current levels, the oil price especially benefits oil-importing countries, like China, India and Indonesia, but also Europe.
US Shale Oil and Gas
US shale oil and gas is the major supply driver of the recent years, especially the smaller companies operating in this market. A problem that these companies have is their high debt levels. To finance operations these companies are highly dependent on the debt markets and banks. The current oil price trend has an adverse effect on the willingness of investors and banks to lend money to these companies. WHB Energy has been the first large significant fracking company to enter bankruptcy, and others will surely follow if prices stay on a low level. Many corporations have to make debt re-payments in the first half of 2015 we will see how many corporations will struggle due to this. 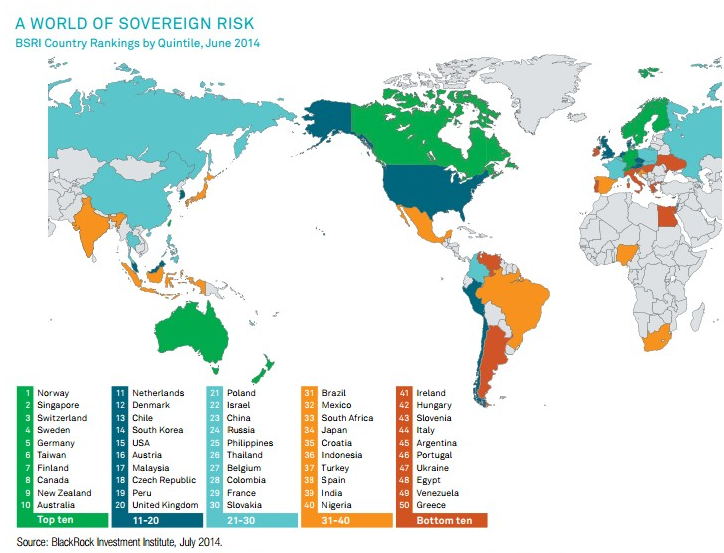 Elasticity of Demand
Lower oil prices will result in lower prices for gasoline and other energy prices, which should (in theory) lead to higher demand. The oil industry is very complex and with the consumer being the winner on one side, many companies beyond energy companies are also suffering. For example, Caterpillar and US Steel are both planning to lay-off employees due to reduced demand from energy companies.
OPEC
The OPEC cartel can be seen as the most powerful institution of the oil industry. Although it is a loose organization of oil exporting countries, statements of the organization shape expectations which become realities. In a surprise move, OPEC announced no plan to cut oil output in an attempt to push more expensive production (such as US fracking rigs) out of profit. This is a risky move to flood the market with oil in the short term, and hope it causes a drop in supply resulting in much higher prices in the long term.
Geo-political crises
Crises always have been a pretext for rising oil prices. Iraq war, fracturing Libya, instability in Nigeria, or whenever else a crisis emerged in an oil exporting country, oil prices have risen in anticipation of reduced supply. Now that oil prices are lower, governments of oil exporting countries will struggle to cover their budgets.
Our impression that oil prices are currently driven down on speculation is also supported by data of big oil traders. These traders hire huge crude carriers, fill them will oil and park them in anticipation of rising oil prices in the future. In the short run, there could be more downside pressure on oil, maybe even leading to an oil price below US$30. However we see it as highly unlikely that prices will remain that low as production costs of most oil producers are much higher.
Russia and the world
Despite the Western perspective that Russia is isolated, facts show something different. It seems that on the short run Western politics could be successful with their punishment strategy of isolating Russia from trade activities and from hard currency liquidity. As we have seen in the analysis before, there does not seem to be an imminent threat that Russia would not be able to repay its government debt. The real threat could arise in the corporate debt market and the banking sector. The latest actions by the Russian government have shown an eagerness to solve these problems by providing liquidity from central bank foreign currency reserves.
Some analysts point out that Russia is on the verge of bankruptcy, however, this thinking is quite static and does not take into account that Russia sells goods, especially commodities, for hard currency. Providing a steady inflow of money, helping Russia and Russian corporations to repay hard currency debt, especially US Dollar denominated. Many analysts also forget about the possibility for Russian corporations to roll over the debt with Chinese and Hong Kong based financial institutions which are still able to engage with Russian companies.
The year 2015 will be particular difficult for Russia in political and economic terms. Sanctions most probably will stay in place over most of 2015. We do not expect any tougher sanctions by Europe. The United States might go a different way, following their own political and economic agenda. This could lead to a divergence between European and US politics, which might help to improve EU-Russia relations. However, the standoff over Ukraine has the potential for unpredictable events that could change the situation rapidly. Inflation in Russia will rise quickly, most likely being close to 20% in 2015. The Russian economy is highly likely to shrink, and at best it will stagnate.
We see Russia not as isolated as Western politicians might hope for. This is shown in recent Russian trade deals between China and India. The New Development Bank, the counterpart to the IMF, is a clear sign in the rising self-confidence of emerging markets. With China as an economic super power, coordinated actions could overcome current difficulties and a default by Russia is highly unlikely.
Another step the Russian government already took, was to introduce their own SWIFT system for inter banking transaction within Russia. China signaled its willingness to cooperate and use this alternative system, as well. Assuming this system proves reliable it would mean an end to the Western ruled SWIFT system, based in Brussels, processing most inter-bank transactions.
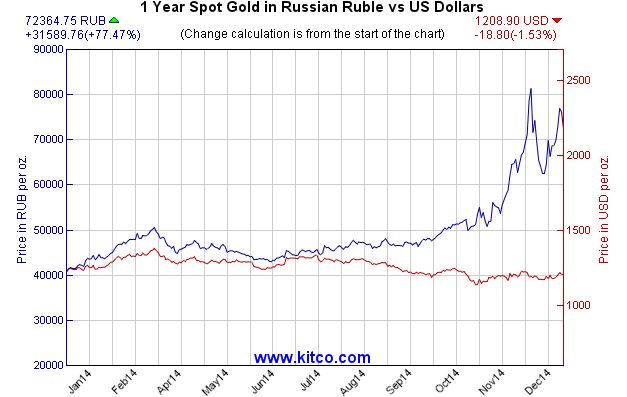
The following charts show the full misery the Russian economy is facing. As the value of the Russian ruble is highly correlated to the price of oil, the Russian government is short of options for intervention. On the other hand, the depreciation of the ruble gives some Russian companies a cost advantage. A big issue will be possible acceleration of inflation. High inflation could in turn lead to social unrest and increasing political tensions.
The ruble devaluation and the gold price in ruble terms shows the ability of gold to serve as a store of value, especially in times of crisis. 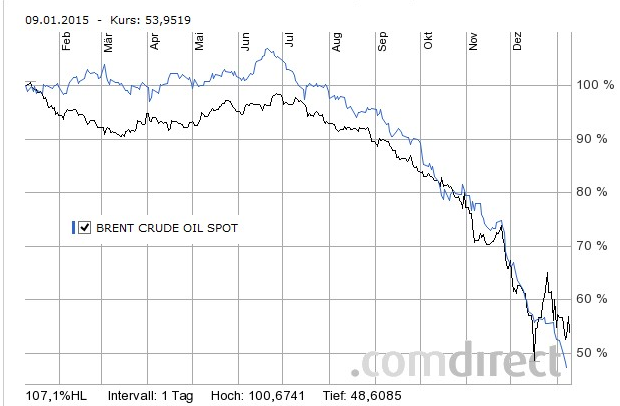
Conclusion and Solutions
The current global economic situation across the globe is uncertain. Chinese growth is slowing and economic figures are weakening. The Chinese central bank might try to cope with this problem by introducing looser monetary and fiscal policies. This would help equity markets, but will probably lead to an asset bubble. The US faces trouble from its shale oil and gas industry, which is about to suffer the most from the rapid decline in oil prices. Other supporting industries will follow, as well as banks due to the high level of fracking corporate debt. Europe is stuck between economic and political disaster. Greek elections have the potential to become an earthquake for the Euro and the UK elections could turn into a referendum on staying in the EU.
There are also unforeseen events which could have a huge impact. Our best solution to face uncertainty is to have a diversified portfolio across asset classes and countries. Most developed nations have adopted so-called bail-in directives, effective from 1 January 2016. This law forces banks that are on the verge of collapse to get cash from their shareholders, bondholders and biggest customers before falling back on taxpayer bailouts. Another crisis and this law most probably will be applied, resulting in savings and pension confiscation. Cyprus was just a test balloon for this.
In this regard, one can also see an option how governments will try to “refinance” excessive debt. These measures are a threat to everybody who acquired some wealth. Looking at the richest of the rich one can see that many of these people are parking their money in foundations or trusts in offshore jurisdictions. Offshore assets are hard to grab by national governments.
Financial repression is another common issue of our time. Due to ultra-low interest rates and historically high bond prices, interest earned on saving accounts and other interest bearing instruments often does not even match the real inflation rate. This leads to a nominal loss for everybody who holds these investments.
Our recommendations are to hold a diversified portfolio where international equities take major share, preferably high dividend stock. A high dividend can pay of greatly over a longer time horizon. We would also recommend adding certain corporate bonds which seem to offer good value. Depending on the risk appetite of the individual investor, structured notes can be added to the portfolio to enhance expected returns.
Our preferred investments topics:
Trend industries: Cyber-Security + big data, robotics, renewable energy (solar) and online education
Contrarian investments: Russian equity market, oil producers, precious metals, mining companies
Fixed Income: Investment grade corporate bonds, selected High-Yield corporate bonds, emerging markets sovereign bonds (preferably denominated in USD or selected bonds in local currency, like the Chinese Renminbi)
Preferred sectors: Water, Infrastructure/Utilities, Health Care Regions: Asia, Europe – preferably currency hedged.
Appendix 1  Links:
BlackRock Sovereign Risk Index http://www.blackrockblog.com/blackrock-sovereign-risk-indicator/
DISCLAIMER: Comments/charts do not necessarily imply their suitability for individual portfolios or situations in respect of which further advice should be sought. Shoreline is not responsible for the content of external internet sites.This information used in this newsletter has been prepared from a wide variety of sources that Shoreline, to the best of its knowledge and belief, considers accurate. You should make your own enquiries about the investments and we strongly suggest you seek advice before acting upon any recommendation. The opinions expressed in this report are those held by the authors at the time of going to print. The views expressed herein are not to be taken as advice or recommendation to sell or buy shares. This material should not be relied on as including sufficient information to support an investment decision. Any forecasts or opinions expressed are Shoreline’s own at the date of this document and may be subject to change.
WARNING: Investing involves risk. The information provided by Shoreline in this newsletter is for general information only, which means it does not take into account your investment objectives, financial situation or needs. You should therefore consider whether the advice is appropriate to your investment objectives, financial situation and needs before acting upon it, seeking advice from a financial adviser or stockbroker if necessary.